Statistics
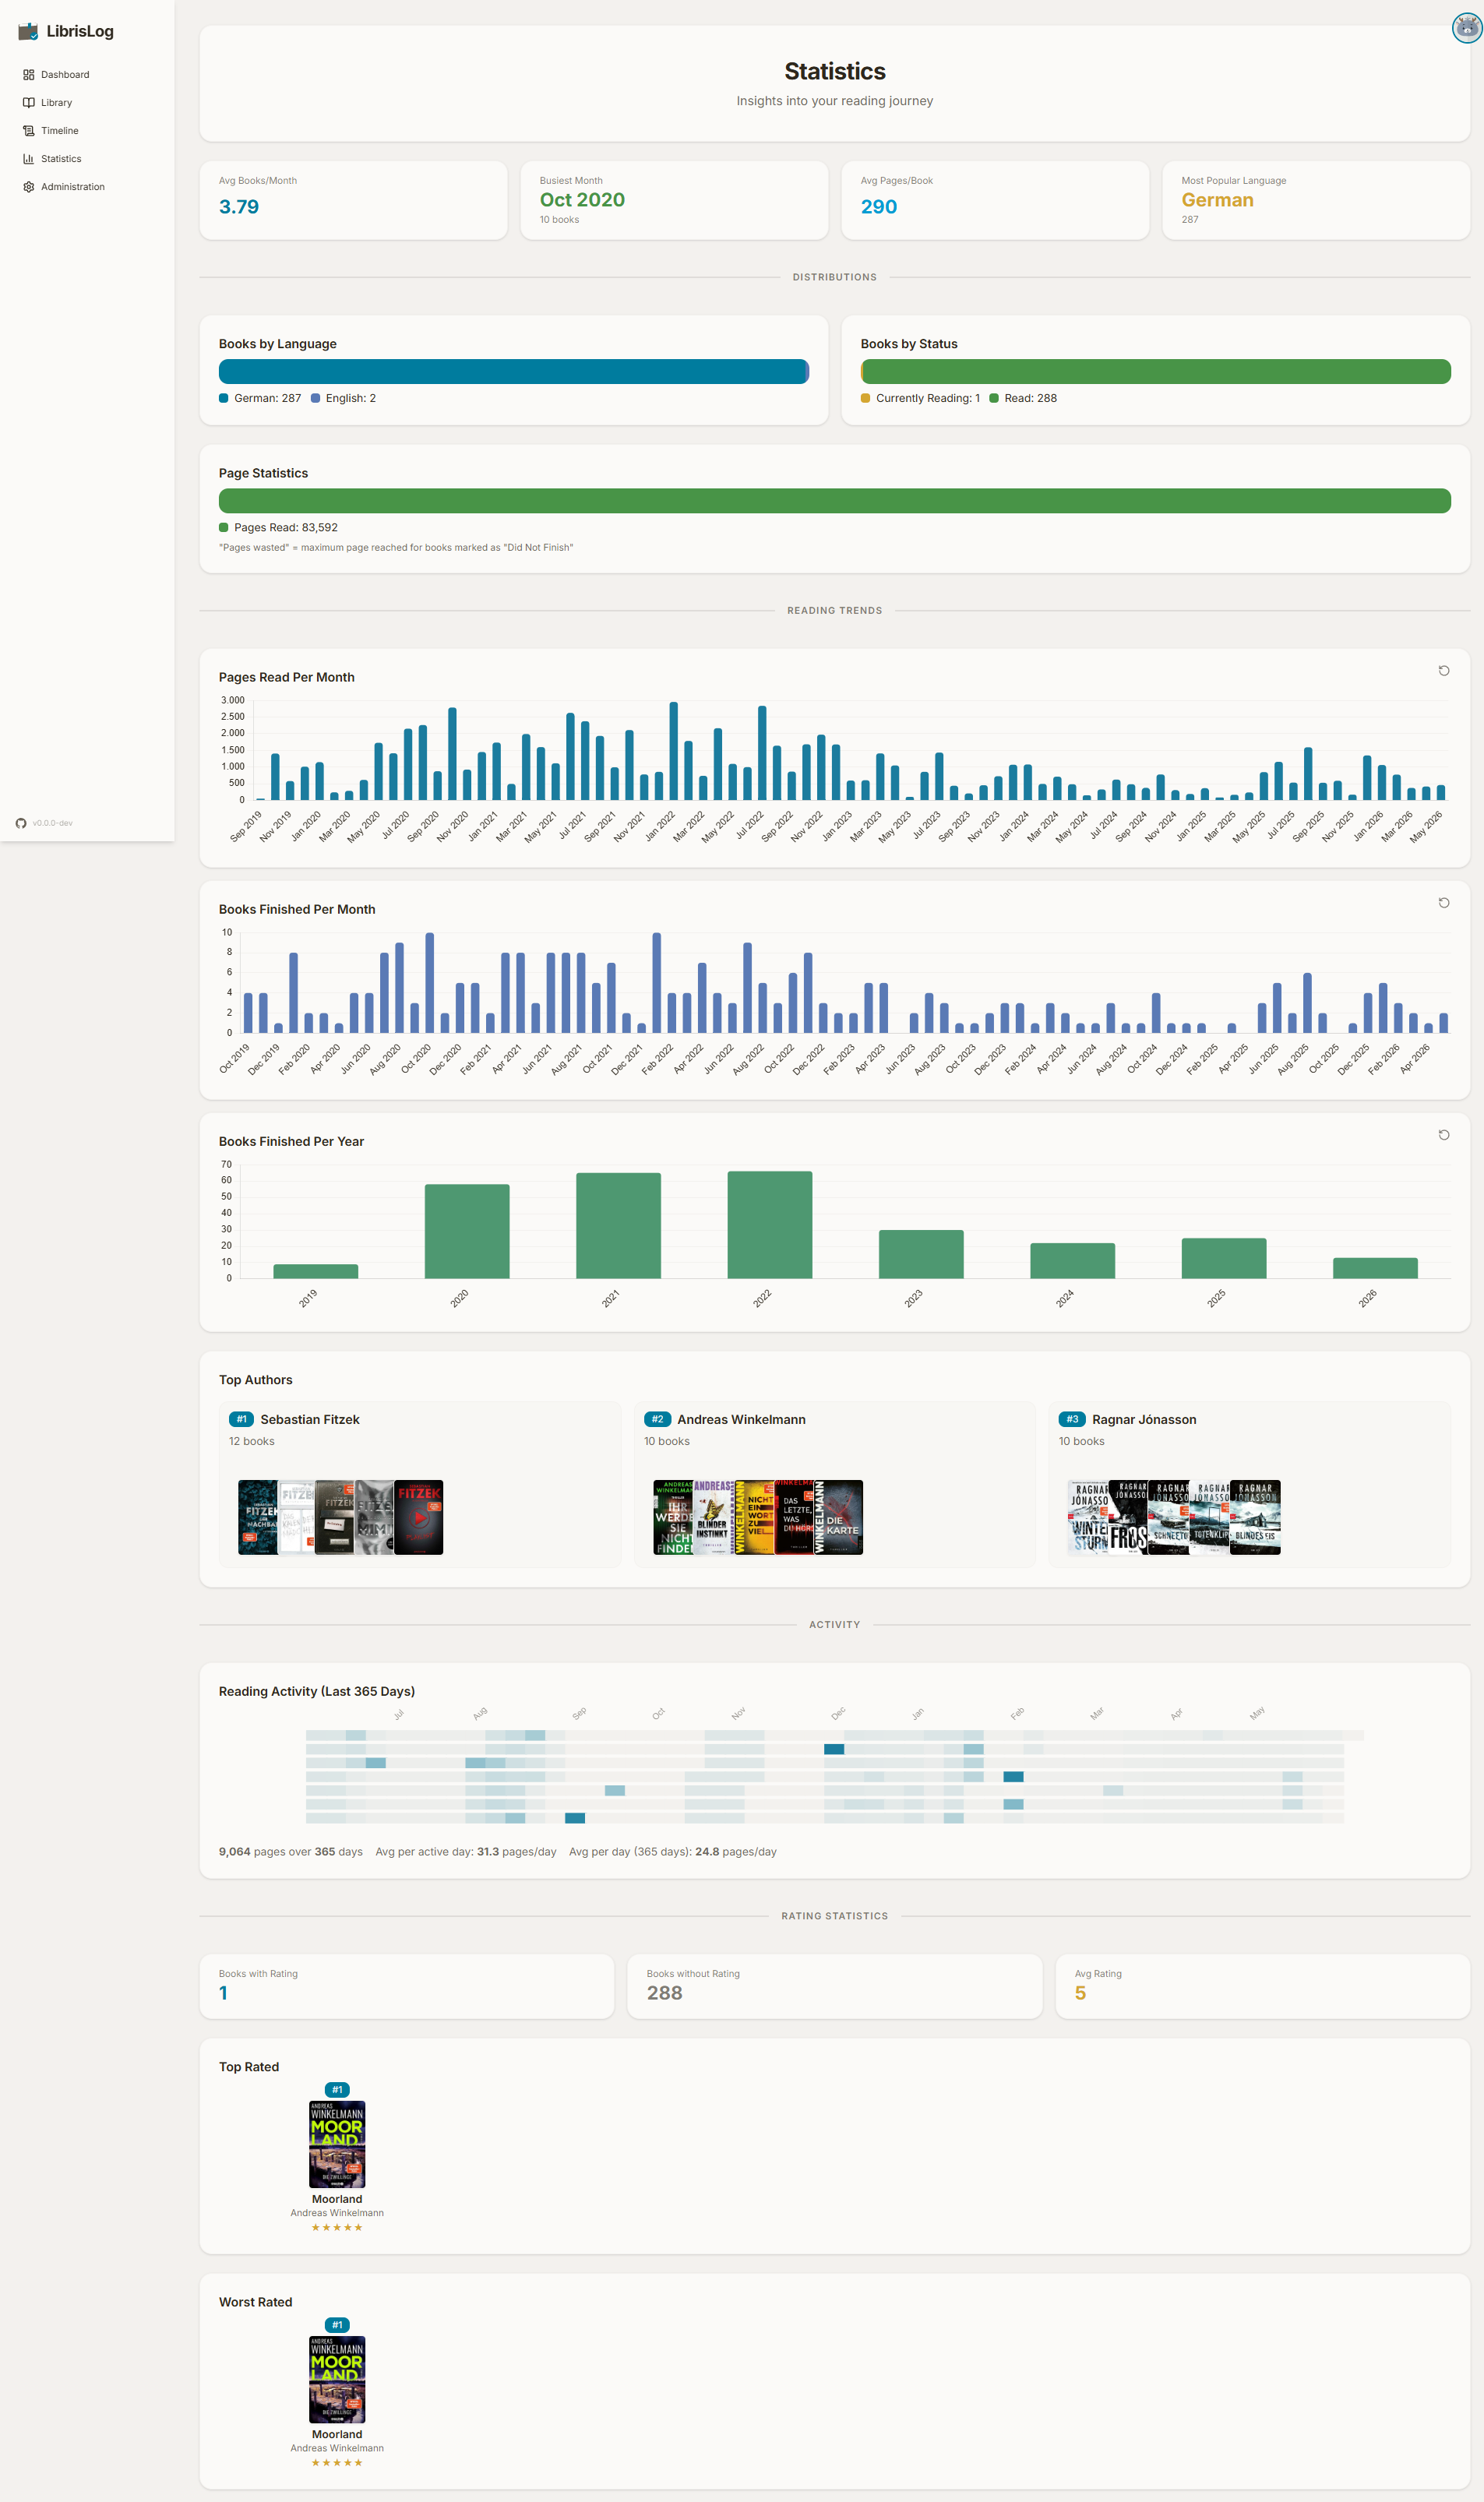
The statistics page provides insights into your reading habits with charts, totals, and visualizations.
Overview Cards
At the top of the statistics page, four key metrics are displayed:
| Metric | Description |
|---|---|
| Avg Books/Month | Average number of books finished per month |
| Busiest Month | The month with the most books finished |
| Avg Page Count | Average number of pages across all books |
| Most Popular Language | The language you read most (based on book count) |
Distribution Charts
Language Distribution
A stacked bar showing the proportion of books by language. Colors represent different languages, with a legend below the chart.
Status Distribution
A stacked bar showing how your library is divided among the four reading statuses:
- Want to Read (blue)
- Currently Reading (yellow)
- Read (green)
- Did Not Finish (red)
Page Buckets
A stacked bar showing:
- Pages to Read — Total pages in "Want to Read" books
- Pages Read — Total pages in "Read" books
- Pages Wasted — Pages read in "Did Not Finish" books
Bar Charts
Three bar charts show trends over time:
Pages Read Per Month
Bar chart showing total pages read each month. Based on page counts of books marked as "Read" in that month.
Books Finished Per Month
Bar chart showing the number of books finished each month.
Books Finished Per Year
Bar chart showing the number of books finished each year.
All bar charts support zoom and pan interactions. Click the reset button to restore the default view.
Calendar Heatmap
A GitHub-style calendar heatmap shows daily reading activity:
- Each square represents one day
- Color intensity indicates pages read that day
- Darker colors = more pages
- Hover for exact page count
The heatmap is based on reading progress entries, not just book finish dates, so you can see daily reading patterns.
Top Authors
The top 3 authors by book count are displayed with:
- Author name and rank badge
- Book count
- Up to 5 cover images from their books (click to open book details)
Data Sources
Statistics are computed from:
- Book metadata (page counts, languages, statuses)
- Reading progress entries (for calendar heatmap and timeline)
- Book finish dates (for monthly/yearly charts)
All statistics are calculated server-side and updated in real-time when you modify your library.